Discovery Report Views
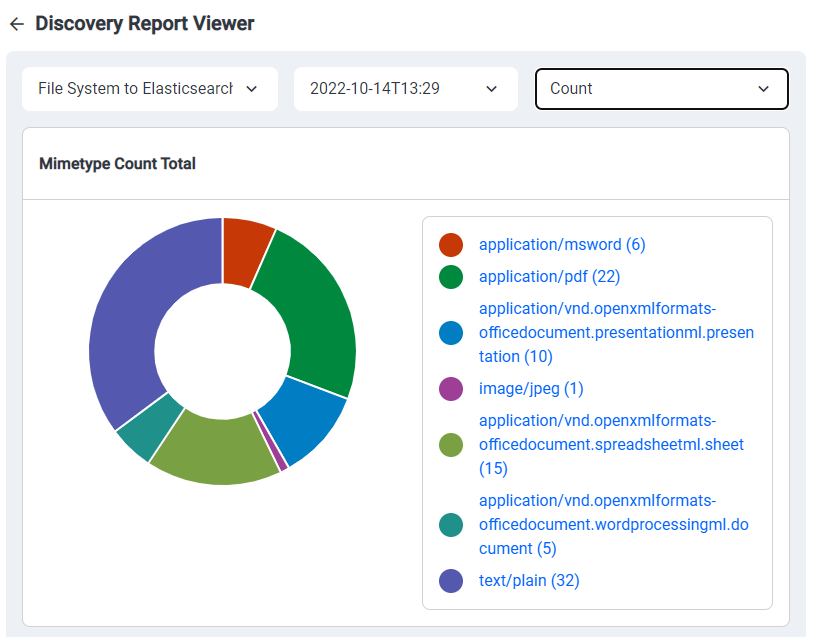
Once you have finished with your Data Collection, 3Sixty allows users to visualize their data in a Discovery Report View in the Discovery UI
In this report view users will find:
-
An interactive chart that adjusts to selected repositories
-
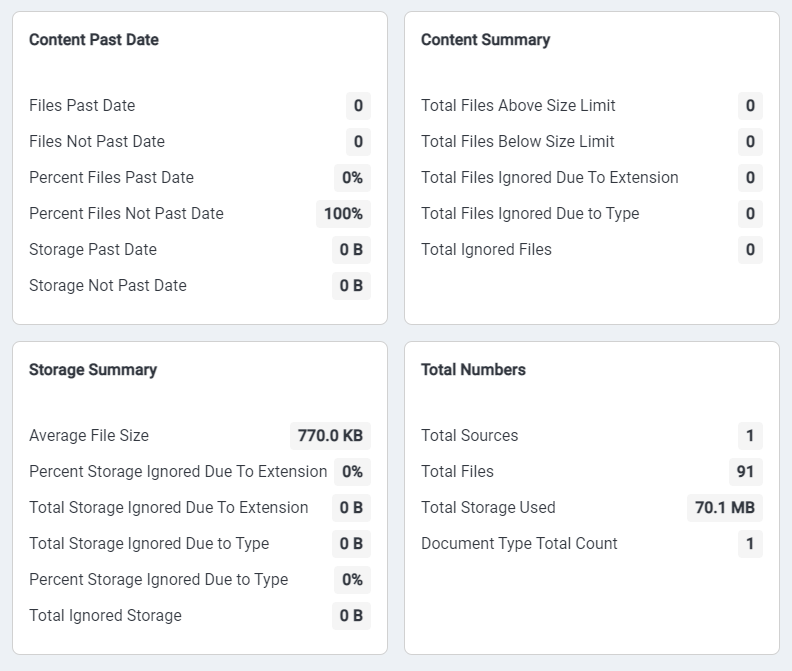
Content Past Date
-
Content Summary
-
Storage Summary
-
Total Numbers of files
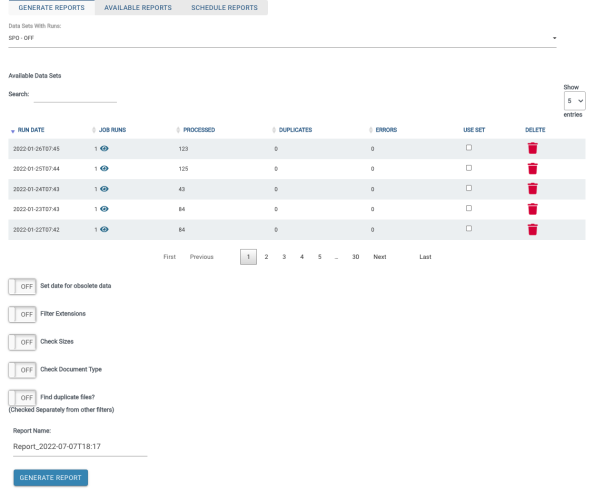
This tab initially only contains a drop-down of data sets that have job runs associated with them. It also displays their collection status.
Upon selecting a data set you should see the following:
-
Included in the table are the date of the run, number of job runs included in the dataset, as well as some general stats on the document counts. The table is sortable on the various values.
-
Clicking the eye icon next to the job run count will open a pop-over with the individual job run ids
-
Clicking one of these ids will take you to a detailed view of the job run. For content reporting you are currently only allow to select one dataset.
-
In the future a "Content Growth Report" option will be made available, allowing you to select multiple job runs to monitor increases in storage usage.
Filter Dataset
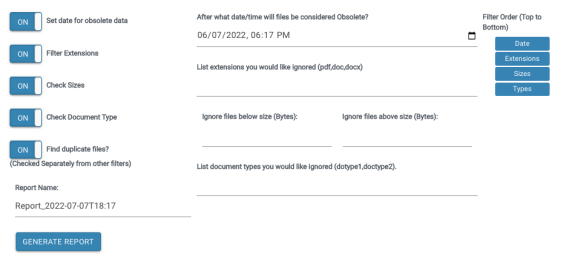
There are a number of filters that can be applied to the dataset during report generation. These include:
-
Filters for Obsolete Date
-
Checked against the Last Modified Date, or Created date if the former is unavailable
-
Filters for certain file type extensions.
-
Extracted from filename
-
Filters for file size
-
(New) Filters for type. Document types can also be filtered out.
These filters are processed in this order, upon selecting them you will have the option to reorder them.
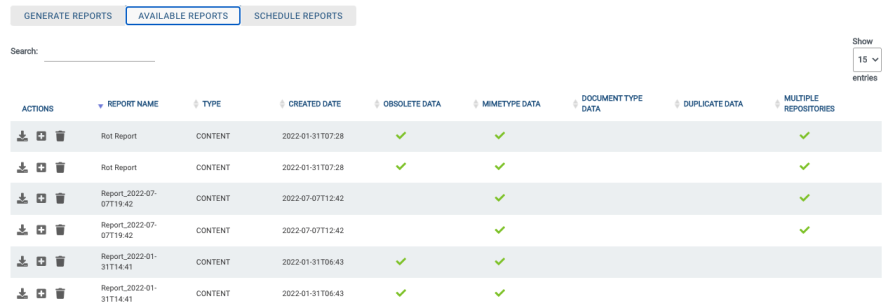
Upon completion of report generation you should be taken to the Available Reports tab.
This tab shows the generated reports as well some additional information:
-
Obsolete Data: The report contains data on content that was past the filter date
-
Duplicate Data: The report has information on duplicates
-
Content Type Data: The report contains a content type breakdown for all included repositories.
-
Multiple repositories: The report contains data for each of the jobs run as part of the dataset, as well as a merged report containing the combined data.
-
Actions:
-
Download the raw report in JSON format
-
Generate New Version of this Report
-
Delete Report with the additional option to delete all versions of the report
-
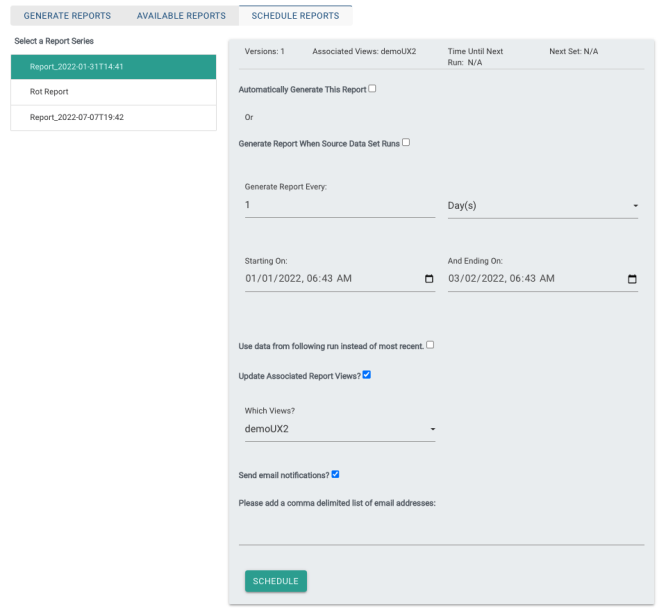
The schedule reports tab allows you to automate the creation of reports after creating the initial one.
-
Automatically Generate This Reports: Enables the scheduling of this report's creation
-
Generate Reports Every: The time interval to use for generating this report.
-
Starting On and Ending On: How long the schedule lasts. If the Before time is set before the current time, generation will accrue immediately upon setting the schedule.
-
Update Associated Report Views: Each Discovery Content View is associated with a single report series. If set to On, the view will be updated to use the most current version each run.
-
Which views: A list of associated views to update.
-
Use Data From the Following Set or Most Recent: If checked, the new report will always use the next data collection chronologically from the previous. Otherwise the most recent data set will be used. Useful if you wish to perform QA on the most recent runs before creating a new report.
-
Send email Notifications: A simple yes/no. Email must be enabled for the application.
-
Comma delimited list of emails: As the tooltip says.
Related Articles: